Capstones Explore Problems in Medical Imaging, Finance, Public Health and More
May 18, 2016
Working with the Institute’s industry partners, six teams of master’s students presented their capstone projects earlier this month. They took on problems at the forefront of medical imaging, finance, public and environmental health, advertising and marketing.
“They collected and aggregated real-world data and considered it from all angles to answer the questions at hand,” said computer scientist Ansaf Salleb-Aouissi, who taught the capstone class. “A combination of analysis and visualization techniques allowed them to reach conclusions that can lead to more informed decisions.”
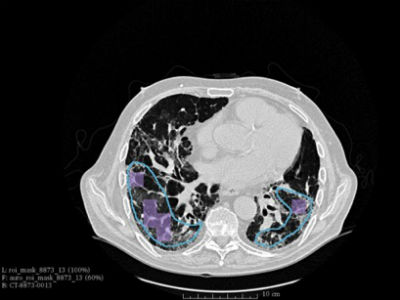
Teaching Computers to Spot Damaged Lung Tissue
Picking out abnormal lung tissue in high-resolution CT images of the lung takes time and skill. In a project in collaboration with General Electric Global Research, the team built a model for predicting whether high-resolution images of lung tissue showed evidence of scarring, or pulmonary fibrosis. They trained their model on lung-scans from 101 patients that had been examined by a specialist who had highlighted pathogenic tissue. Using deep learning methods, their model learned to identify when an image was likely to reflect pulmonary fibrosis. Their final model returned a median error rate of 13.5 percent, slightly less than similar experiments. They used MATLAB’s Deep Learning Toolbox to build their model. With their professor, Ansaf Salleb-Aouissi, and adviser at GE, Mirabela Rusu, they have submitted their results for inclusion at the Biomedical Engineering Society’s annual meeting in October in Minneapolis.
Students: Xavier Ignacio Gonzalez and Diego Llarrull
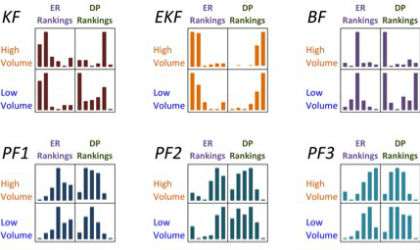
Finding Mispriced Securities by Predicting Short-term Price Changes
If investors can tell when a stock or bond is undervalued or overvalued, they can pick the best time to buy or sell. Working with a financial firm in New York City, the team developed a framework for detecting mispriced securities using the Kalman, Extended Kalman, Bootstrap and Liu-West Particle filtering algorithms. The algorithms filtered minute-by-minute price variations in 160 stocks, bonds, commodities and index funds over a six-month period. The team found that the filters together produced an absolute error rate a third that of the Auto-Regressive-Moving-Average (ARMA) model, a common financial benchmark. Among the filters, they found that the Bootstrap method worked best and that mispriced, relatively illiquid securities were the easiest to detect. The team worked with financial data supplied by Bloomberg; built their filters with Python’s NumPy and SciPy packages; and visualized the results in R and Excel.
Students: Chunfeng Dong, Qianyi Zhao and Sergey Ulyanenko
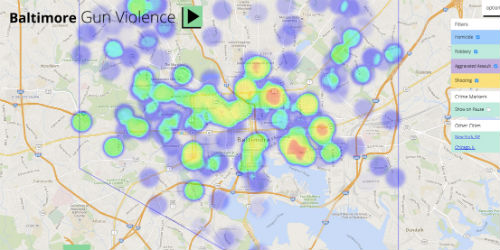
Putting a Price on Gun Violence Prevention
Reducing gun violence has far-reaching benefits for a community, including cost-savings. In a project for Cure Violence, a nonprofit based at the University of Illinois-Chicago, the team developed a cost-benefit model to measure the effects of Cure Violence’s intervention efforts in Baltimore, Chicago and New York. They found that for each murder averted, governments would save $440,000, mostly by avoiding the cost of imprisoning someone for life. The team also developed a “heat map” that tracks gun-violence incidents in Baltimore, Chicago and New York through time using open source data and code. Though violence has gone down nationally, and in the cities where Cure Violence works, the map lets Cure Violence prioritize target areas and quantify the impact of their work for key stakeholders.
Students: Andy Enkeboll, Erin Grand and Mayank Misra.
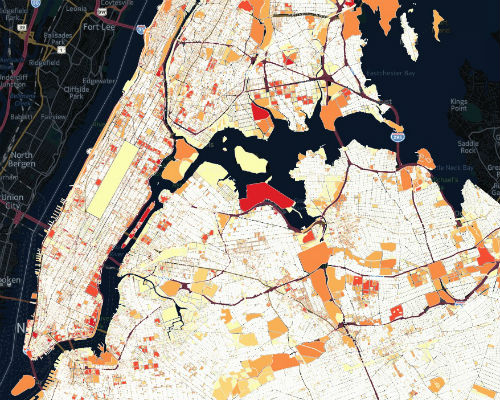
Predicting Trash Hot Spots in New York City
Rain and melting snow send trash from New York City streets into streams and rivers and eventually the Atlantic Ocean. In a project for the New York City Department of Environmental Protection (DEP), the team analyzed six years of 311 trash complaints, tax records, and other data to see if they could spot trends that could help the DEP address the problem.
Their model found that population-density was the single best predictor of trash complaints. Neighborhoods with more trash complaints tended to have buildings with multiple floors (indicating more residents, employees and customers) and lower property values. They used tax map data to produce “heat maps” of high-complaint areas that city employees could target for cleanup and enforcement action. The team used R, MySQL and CartoDB to clean, analyze and visualize their data.
Students: Shruti Pandey and Robert Piccone
Predicting which Ads Will Close a Sale
The digital era has brought a new level of precision to advertising as companies learn instantly whether their online ads persuade people to visit their site, join their cause or buy their product. Adtech firms like New York City-based MediaMath serve as brokers, bidding on ad-displays for their clients and adjusting their strategy based on machine-learning models that predict user response to ad exposure. The team worked with MediaMath to analyze six weeks of impressions, or ad exposures, and the actions they prompted, be it a prospective customer clicking on a Website, downloading an app or making a purchase. They built a variety of models to predict how users would act based on time of day, location, type of device and previous exposure to an ad, among other variables, and achieved an 80 percent precision rate in identifying responsive users.
Students: Konstantinos Psychas, Cathy Jing Qiu and Chuwen Xu
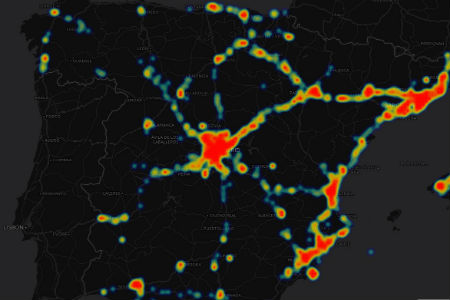
An App that Analyzes Mobile Phone Data To Recommend Places to Go
Every few minutes, our mobile phones ping the nearest cell-tower, providing valuable data about our daily movements. In a project for Synergic Partners, a consulting firm in Spain, the team developed an application that analyzes and integrates information about a user’s location, and texting and calling habits, to recommend nearby stores and other places to visit across Spain. The platform includes a dashboard, interactive reports and visualization features. Another feature under development is an integrated recommendation engine that predicts how likely a user is to visit a nearby bar, restaurant, park or store based on their past movements and that ofsimilar mobile-phone users. The team used Python, Flask and PostgreSQL to build the core of the platform; cartoDB to map and analyze location data; and scikit-learn library to create the building blocks of a recommendation engine.
Students: Elias Hussen and Pragya Kishore.
— Kim Martineau